U.S. economic growth continued in the third quarter of 2019
Global stock markets were mixed in the third quarter. U.S. large-cap stocks performed well, but U.S. small-cap and non-U.S. stocks struggled. While we never know for sure what caused market prices to move, continuing trade tensions, an attack on major Saudi oil facilities, slowing global economic growth, and falling interest rates were all potential sources of market volatility.
For the quarter, U.S. stocks (as measured by the S&P 500 Index) gained 1.7%, and non-U.S. developed market stocks (as measured by the MSCI World Ex U.S. Index) fell 0.9%. Emerging market stocks (as measured by the MSCI Emerging Markets Index) fell 4.3%.
The U.S. Dollar Index, a measure of the value of the U.S. dollar relative to a basket of foreign currencies, rose in the third quarter. Specifically, the U.S. dollar increased by 2.7% compared to foreign currencies. Over the past 12 months, the U.S. dollar has appreciated 3.6%. The increase in the dollar represents a headwind to non-U.S. investments held by U.S. investors
U.S. interest rates fell during the quarter as the Federal Reserve implemented two reductions, each a quarter of a percentage point, to the federal funds rate. The Fed now targets a range of 1.75% to 2.00% for the federal funds rate. Because changes in interest rates and bond prices are inversely related, the decline in interest rates helped increase the quarterly return for many bond asset classes.
U.S. Economic Review
Positive economic growth in the U.S. continued into 2019’s third quarter. The final reading for third quarter GDP showed an increase in economic growth of 2.0%. The unemployment rate reached its lowest level in 50 years with the September 2019 reading coming in at 3.5%. Domestic inflation remains tame, as the Fed’s preferred gauge of overall inflation, the core Personal Consumption Expenditures (PCE) index, stayed below the central bank’s 2.0% target with a reading of 1.8% in August 2019.
Sources: Bureau of Economic Analysis, Bureau of Labor Statistics, U.S. Department of the Treasury, Morningstar Direct 2019.
Financial Markets Review
U.S. large-cap stocks and real estate investment trust (REIT) stocks advanced during the quarter, whereas U.S. small-cap and all three non-U.S. stock categories we track were down for the quarter. The strengthening U.S. dollar affected non-U.S. stock returns. During the quarter, U.S. REIT stocks were the best performing asset class while emerging market value stocks were the worst performing. U.S. and global bonds added some stability of return during the quarter by posting positive results.

Source: Morningstar 2019. Market segment (Index representation) as follows: U.S. Large-Cap Stocks (S&P 500 Index), U.S. Value Stocks (Russell 1000 Value Index), U.S. Small-Cap Stocks (Russell 2000 Index), U.S. REIT Stocks (Dow Jones U.S. Select REIT Index), International Value Stocks (MSCI World Ex USA Value Index (net div.)), International Small-Cap Stocks (MSCI World Ex USA Small Index (net div.)), Emerging Markets Value Stocks (MSCI Emerging Markets Value Index (net div.)), U.S. Short-Term Bonds (BofA ML Corp&Govt 1-3 Yr TR), Global Bonds (FTSE WGBI 1-5 Yr Hdg USD).

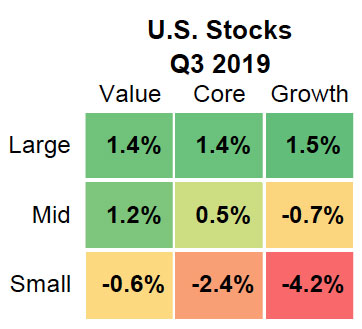
In the U.S., large-cap stocks outperformed small-cap stocks in all style categories. Value stocks outperformed growth stocks in the mid- and smallcap categories. Among the nine style boxes, largecap growth stocks performed the best, and small-cap growth stocks experienced the largest decline during the quarter.
Source: Morningstar Direct 2019. U.S. markets represented by respective Russell indexes for each category (Large: Russell 1000, Value, and Growth; Mid: Russell Mid Cap, Value, and Growth; Small: Russell 2000, Value, and Growth).

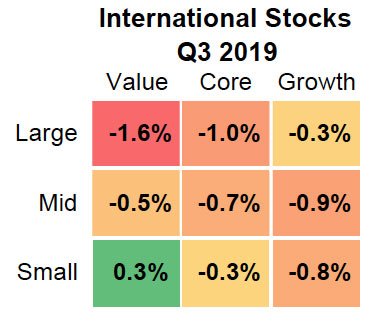
In developed international markets, most of the nine style boxes were negative for the quarter. International small-cap value stocks were the lone bright spot. Similar to the U.S. mid- and small-cap value stocks outperformed mid- and small-cap growth stocks.
Source: Morningstar Direct 2019. International markets represented by respective MSCI World EX USA index series (Large: MSCI World EX USA Large, Value, and Growth; Mid: MSCI World Ex USA Mid, Value, and Growth; Small: MSCI World Ex USA Small, Value, and Growth).
A diversified index mix of 65% stocks and 35% bonds would have gained 0.3% during the third quarter.
Our evidence-based investment approach focuses on investing for the long-term. Portfolio allocations and investments are not adjusted in response to market news or economic events; however, we evaluate and report on market and economic conditions to provide our investors with perspective and to put portfolio performance in proper context.
Let us help you sort through the clutter and weather the market’s uncertainties. Please call us if you have questions or concerns.
