
Inverted Yield Curve: What Does it Mean and How Should You Invest?
What is an inverted yield curve?
Traditionally, fixed income yield curves are upward sloping, meaning longer-term bonds offer a higher return than their shorter-term counterparts. This makes sense as investors should demand more return for agreeing to hold longer-term bonds as compensation for bearing more interest rate, inflation or credit risk.
Occasionally, short-term bonds will yield more than longer-term bonds. This is called a yield curve inversion. Yield curve inversions can be measured in a number of ways, but the most common measurements are the difference in yield between either the 3-month (3M) or 2-year Treasury (2Y) and the 10-year Treasury (10Y). Research shows that yield curves invert prior to a recession, so when this happens, it tends to attract a lot of media attention.
What does the yield curve look like today?
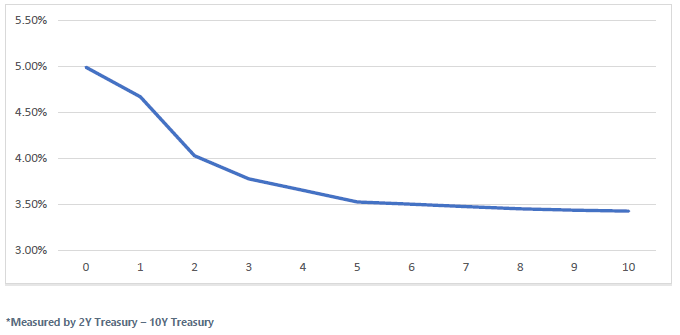
During the first half of 2022, the yield curve flattened considerably as the Federal Reserve began raising the federal funds target rate to combat inflation, but it remained positively sloped. Shortly after the Fed’s sixth rate hike in June, however, the yield curve inverted* on July 6. The curve remained inverted through 2023, peaking on March 8 at -107 basis points (bps), and it has flattened considerably as short-term rates have fallen in response to the turmoil created by the Silicon Valley Bank failure on March 10. As of April 11, the yield curve remains inverted with 2-year Treasuries yielding roughly 60 bps more than 10-year Treasuries, as shown below.
What does an inverted yield curve tell us?
Economist Campbell Harvey of Duke University first showed that an inverted yield curve can forecast recessions in the late 1980s, and the relationship has largely held since this discovery. The reason is that an inverted yield curve reflects the market’s expectation that interest rates will decline as a result of deteriorating economic conditions. Since 1955, yield curve inversions* have preceded recessions by anywhere from six to 24 months, according to a 2018 study by the San Francisco Fed, and it only once offered a false signal.
Anu Gagger, global investment strategist for Commonwealth Financial Network, went a step further and looked at data back to 1900. She found the yield curve* inverted 28 times over the period with a recession following on 22 of those occasions. Focusing on the most recent six recessions, on average, they began anywhere from six to 36 months after the curve initially inverted.
Should investors lower their equity allocation when the yield curve inverts in anticipation of a potential recession?
Buckingham Wealth Partners’ Head of Investment Research Jared Kizer looked at this issue. He analyzed the data and found that stocks still outperformed T-bills following a yield curve inversion over the subsequent three- and five-year periods. While an inverted yield curve may be a reliable indicator that a recession is forthcoming, it does not give you enough information to profitably time the market.
How should investors structure their fixed income portfolio when the yield curve is inverted?
When yield curves are inverted the natural tendency of investors is to park their money at the short end of the curve. This seems intuitive – why would anyone want to extend out on the curve when they can get higher yields on short-term bonds?
To answer this question researchers from Raymond James & Associates examined how intermediate-term bonds performed versus short-term bills during the three most recent curve inversions prior to the present inversion. The analysis centered on the returns of both 5- and 10-year Treasuries versus 3-month T-bills if purchased at the point of maximum inversion and held to maturity. Below are their findings:
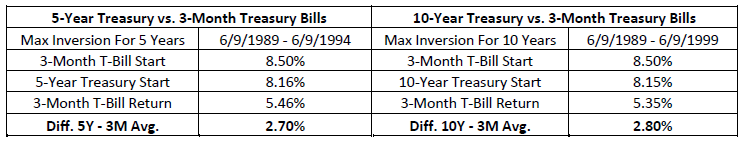
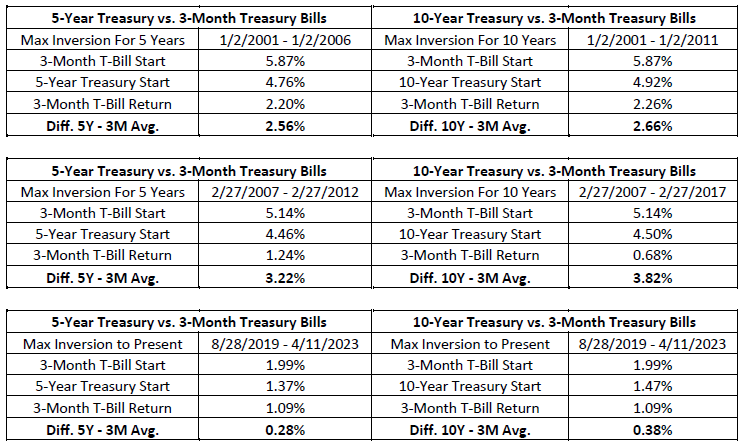
As the data shows, buying intermediate-term bonds at the height of a yield curve inversion produced higher returns than an investment strategy focusing on short-term bonds. Given this information, we would encourage clients not to alter their fixed income strategy and continue to invest in high-quality bond ladders that include both short- and intermediate-term bonds.
The content of this article was provided by Buckingham Strategic Partners, not an employee of Kraft Asset Management.
Kraft Asset Management, LLC (KAM) is a registered investment advisor. This article is being provided for informational purposes only, does not constitute investment advice and does not necessarily represent the opinions of KAM. KAM does not provide any guarantee, expressed or implied, that the information presented is accurate or timely, and does not contain inadvertent technical or factual inaccuracies. The past performance of securities is no guarantee of their future result. The value of any investment may fall, as well as rise, and investors may not receive the full amount of their principal at the time of redemption if asset values have fallen.
For informational and educational purposes only and should not be construed as specific investment, accounting, legal, or tax advice. Certain information is based on third party data and may become outdated or otherwise superseded without notice. Third party information is deemed to be reliable, but its accuracy and completeness cannot be guaranteed. Neither the Securities and Exchange Commission (SEC) nor any other federal or state agency have approved, determined the accuracy, or confirmed the adequacy of this document. R-23-5518