
2018 Market Review
After logging strong returns in 2017, 2018 turned out to be one the strangest years we have seen, as global equity markets turned negative despite several highly favorable economic developments. In fact, in terms of financial metrics, 2018 was one of the truly great years in the history of the American economy, and by far the best year worldwide since the global financial crisis of 10 years past. Paradoxically, it was also a year in which the equity market could not get out of its own way.
To cite just a few of the major economic metrics which blazed ahead in 2018: worker productivity, the long-run key to economic growth and a higher standard of living, surged; wage growth accelerated in response to a rapidly falling unemployment rate; household net worth rose above $100 trillion for the first time, yet household debt relative to net worth remained historically low; and for the first time in U.S. history, the number of open job listings exceeded the number of persons unemployed.
“While markets may very well continue to be volatile in the near term, your comprehensive financial plan is fully cognizant of such an event and incorporates the potential for outcomes like 2018’s fourth quarter as well as a wide range of other possibilities.”
In addition, earnings of the S&P 500 companies, paced by robust GDP growth and corporate tax reform, leaped upward by more than 20%. Cash dividends set a new record. Total cash returned to shareholders from dividends and share repurchases since the trough of the Great Panic reached $7 trillion.
But the equity market had other things in mind. Having gone straight up without a correction throughout 2017, the S&P 500 came roaring into 2018 at 2,674, then hit a brick wall in February with a 10% correction. After several months of consolidation, the advance resumed through the summer, with the Index reaching a new all-time high of 2,931 in late September. It then gave way to a second correction, taking back all the year-to-date gains achieved and flipping 2018 returns from positive to negative. The S&P 500 declined 13.5% in the fourth quarter while the MSCI All Country World Index declined 12.8%.
The fourth quarter equity market decline has many investors wondering about the prospects for equities going forward. We believe the historical record is instructive. Prior to 2018, equity market declines of 10% or more have been followed by equity returns which, on average, have been positive 71% of the time in US markets and 72% of the time in other developed markets.1
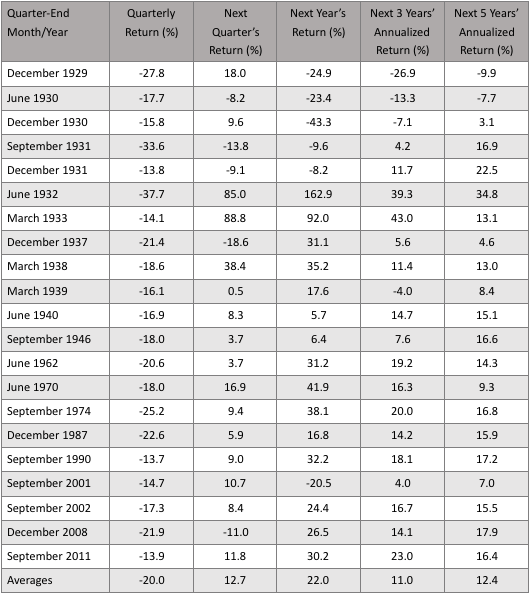
With such dramatic reversals, it is useful to take a closer look at the stock market’s longer-term record so we can put its recent movements in broader context, and also reinforce longer-term investment principles that we continue to believe represent the best course of action (or, more accurately, inaction). The following table catalogs each of the times historically that the S&P 500 has had a quarter equal to or worse than the last quarter of 2018, as well as what happened in periods following that quarter:
S&P 500 Results Following Negative Performance
Performance is historical and does not guarantee future results. Indices are not available for direct investment. Their performance does not reflect the expenses associated with the management of an actual portfolio nor do indices represent results of actual trading. Total return includes reinvestment of dividends and capital gains.
To clarify, the first column lists the last month of the quarter in which the negative return in the second column occurred. For example, in the third quarter of 2011, the S&P 500 declined by 13.9 percent. Columns three through six report the returns in various periods following the quarter of negative performance. Continuing our example, in the year following the third quarter of 2011, the S&P 500 was up 30.2 percent. There are a number of key takeaways from the table:
- Prior to 2018, quarters like the fourth quarter of 2018 had occurred 21 other times over the history of the U.S. market. So, while relatively rare, they are common enough to be able to draw inferences about what tends to happen following such periods.
- More often than not, stock markets are up the next quarter, next year, next three years and next five years following a 10% or greater negative quarter. This is not a surprise. Markets are generally efficient at pricing risk and consequently tend to reward long-term investors for maintaining discipline after quarters of poor stock performance.
- While risk is frequently rewarded, there are no guarantees. We can observe several instances where returns following a 10% or greater negative quarter remained negative, e.g. see the quarter following the fourth quarter of 2008 (although the one-year, three-year and five-year returns following that quarter were all quite strong). Therefore, we remain adamant that trying to predict whether the poor performance at the end of 2018 will continue in 2019 is not a sound long-term investment strategy. Short-term market movements are notoriously difficult to predict.
So, what should a long-term investor do? In most cases, as previously stated (and without meaning to sound glib), we believe the best course of action is inaction. While markets may very well continue to be volatile in the near term, your comprehensive financial plan is fully cognizant of such an event and incorporates the potential for outcomes like 2018’s fourth quarter as well as a wide range of other possibilities.
When might a change to your long-term investment plan make sense? First, if you have experienced a major life change, it’s a good idea to keep your wealth advisor “in the loop,” so that they may consider whether any adjustments to your investment plan would be appropriate to recommend to you. Second, if the level of market risk has made you uncomfortable (we call this the “sleep-well” test), talk to your wealth advisor. We never want short-term market results to affect your quality of life.
1 US markets (1926-2018) are represented by the S&P 500 and Developed ex US markets (1970-2018) are represented by the MSCI World ex USA Index.
All non-US equity market returns are in USD, net dividends, unless otherwise noted.